You signed in with another tab or window. Reload to refresh your session.You signed out in another tab or window. Reload to refresh your session.You switched accounts on another tab or window. Reload to refresh your session.Dismiss alert
In Section 11.1.5, With intention to make multiple tests, Kruschke presented an NHST simulation. From the text, we read:
Suppose that we want to test the hypothesis of fairness for a coin, and we have a second coin in the same experiment that we are also testing for fairness. In real biological research, for example, this might correspond to testing whether the male/female ratio of babies differs from 50/50 in each of two species of animal. We want to monitor the false alarm rate overall, so we have to consider the probability of a false alarm from either coin. Thus, the p value for the first coin is the probability that a proportion, equal to or more extreme than its actual proportion, could arise by chance from either coin....
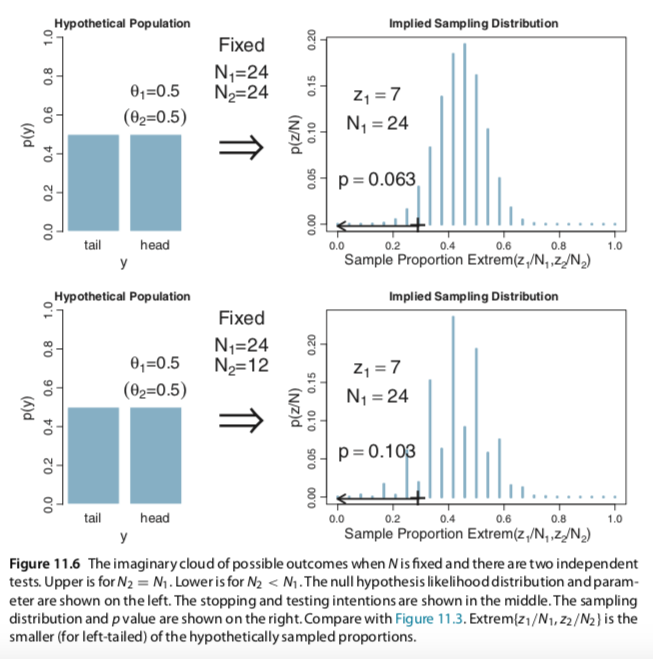
For concreteness, suppose we flip both coins N1 = N2 = 24 times, and the first coin comes up heads z1 = 7 times. This is the same result as in the previous examples. Suppose that we intended to stop when the number of flips reached those limits. The p value for the outcome of the first coin is the probability that either z1/N1 or z2/N2 would be as extreme, or more extreme, than 7/24 when the null hypothesis is true. This probability will be larger than when considering a single coin, because even if the imaginary flips of the first coin do not exceed 7/24, there is still a chance that the imaginary flips of the second coin will. For every imaginary sample of flips from the two coins, we need to consider the sample proportion, either z1/N1 or z2/N2, that is most extreme relative to θ. The p value is the probability that the extreme proportion meets or exceeds the actual proportion.
Figure 11.6 shows the numerical details for this situation. The upper-right panel shows the sampling distribution of the extreme of z1/N1 or z2/N2, when the null hypothesis is true and the stopping intention is fixed N for both coins. You can see that the p value for z1/N1 = 7/24 is p = 0.063. (pp. 310--311)
Here's a copy of Figure 11.6:
If you have the chops to reproduce this simulation and plot, please share your code. If at all possible tidyverse-oriented workflows are preferred.
The text was updated successfully, but these errors were encountered:
In Section 11.1.5, With intention to make multiple tests, Kruschke presented an NHST simulation. From the text, we read:
Here's a copy of Figure 11.6:

If you have the chops to reproduce this simulation and plot, please share your code. If at all possible tidyverse-oriented workflows are preferred.
The text was updated successfully, but these errors were encountered: