You signed in with another tab or window. Reload to refresh your session.You signed out in another tab or window. Reload to refresh your session.You switched accounts on another tab or window. Reload to refresh your session.Dismiss alert
Modern simulation engineering places high demands on software design and functionality. Not only do softwares need to provide extensive and detailed features, but simplicity, elegance, and user-friendliness are also required. The window serves as the direct area of software interaction and is the best way to differentiate various functions. The quality of window design directly affects the user experience. An excellent general-purpose simulation software relates in unison with a good window design. Through years of development and iteration, WELSIM has optimized the design of numerous windows, offering friendly interaction and stability for analyzing various physical fields such as structures, heat, fluids, and electromagnetics. This article uses WELSIM as an example to provide a detailed introduction to commonly used windows in engineering simulation software (including Finite Element Analysis (FEA), Computational Fluid Dynamics (CFD), etc.).
Project Tree
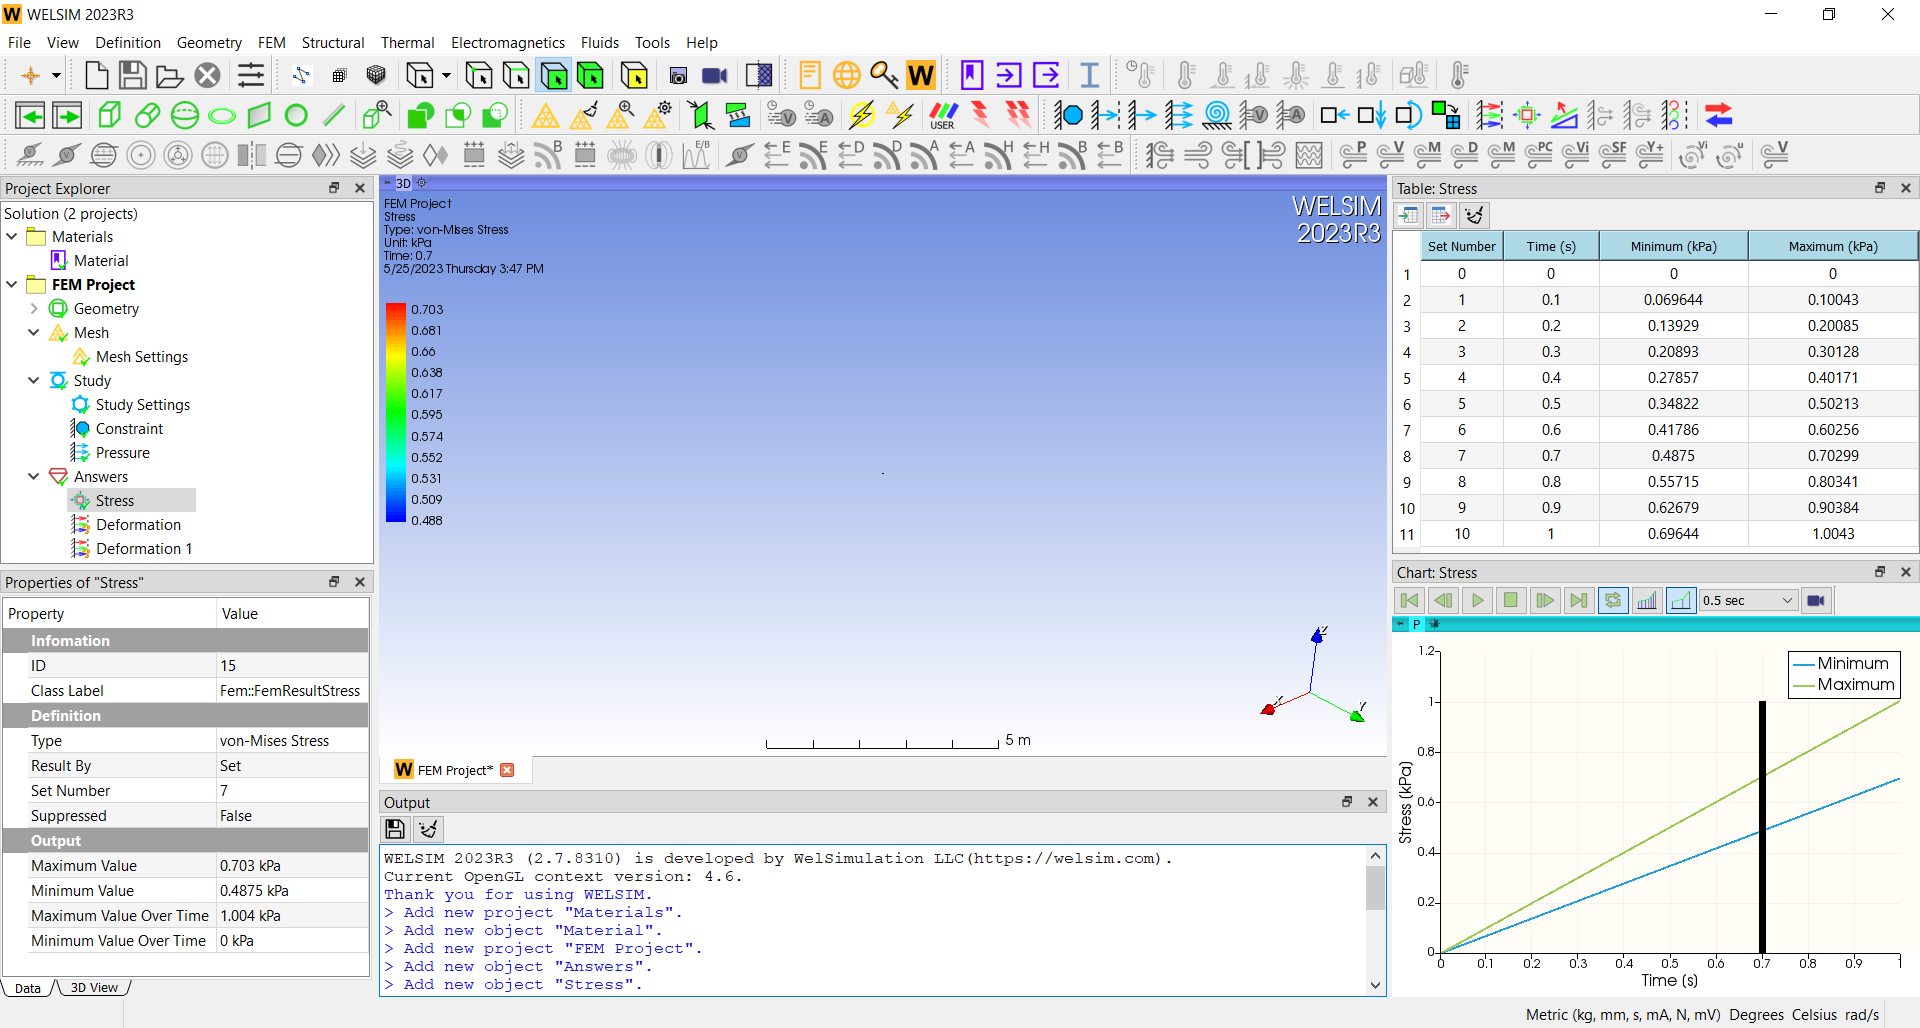
The project tree is an essential window in modern large-scale simulation software and is often placed on the left side of the screen. The tree can handle and express complex relations, intuitively displaying the simulation model to the user as a “what you see is what you get” representation. Users can easily add, edit, duplicate, or delete objects, dynamically controlling the components required for simulation analysis. The right-click context menu in the project tree plays an important role. The context menu is described in further detail in the article, “Design and development of context menu in simulation software”, so it won’t be repeated here.
WELSIM’s project tree provides an object status engine, displaying the current status of each object (e.g., success, error, undefined) in the bottom right corner of the object icon. This feature helps users easily understand the status of all objects, greatly enhancing the user experience. However, designing and developing a usable and maintainable object status engine is a challenge due to the complexity of general-purpose simulation software.
The tree structure itself can handle complex trunk-branch connections, so there is no need for multiple tabs to accommodate multiple trees. WELSIM’s project tree window does not have multiple tabs.
Properties
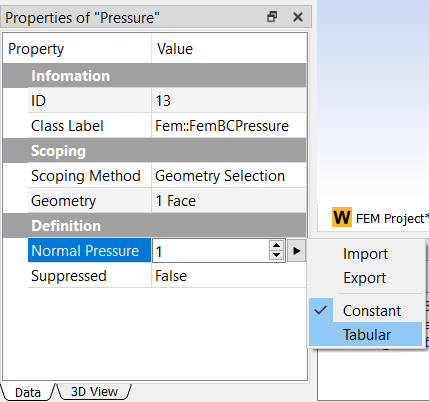
The properties window is a powerful addition to the project tree and is often placed below the project tree window. It serves as the main interface for inputting simulation data. The property window dynamically displays the data content of the current node, allowing users to input or modify data. WELSIM’s property window supports various types of quantities and units, as well as the ability to switch to table data input. This is important for setting various boundary conditions. As shown below, users can change the input of properties from the default constant to tabular.
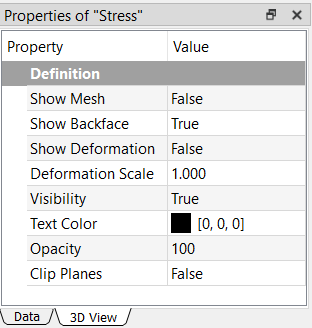
WELSIM’s table window has two tabs: Data and 3D View, with Data being the default tab. For certain objects, control of the 3D display is required, such as changing colors and line styles, displaying mesh, enabling deformations, etc. Separating data and 3D display properties into two different tabs ensures clear categories which enhances the user experience.
3D Graphics
The 3D graphics window occupies the main space on the screen and is the primary module of simulation software. As a result, there are many components that have to be provided. This can present challenges in design and development. If constructed properly, it will provide users with a clear and concise experience. Improper design can lead to negative consequences with user experience, and even lead to product failure. WELSIM divides the 3D view window into nine regions, as shown in the figure below. These nine regions are classified into three levels. The most important first level is located in central Region 1, which is used to display the 3D model and occupies over 70% of the window space. The second level consists of the four corners of the window, notably Regions 2, 3, 4, and 5, which are used to view information, such as the software name and version, 3D coordinate axis, hover menu, 2D annotations, and multi-body penetration selection. The third level is located in the top, bottom, left, and right positions, namely Regions 6, 7, 8, and 9. They are used to display rulers, result color bar controllers, and other elements.
As shown above, each of the numbered regions and their controls has countless details worth discussing, but due to space limitations, they will be explained in future articles.
In addition, the 3D graphics window involves frequent mouse and keyboard interaction. It requires careful design and development to create efficient mouse clicks, wheel scrolls, and actions combined with keyboard functions (such as Ctrl and Shift keys). The mouse interaction design needs to accommodate user habits while being innovative and more accessible.
Selection View
General simulation software involves constant mouse interactions in the 3D graphics area, the majority of the interaction being caused by the selection of geometry or meshes. The WELSIM selection window provides instant selection information to help users confirm their current selection.
It is worth mentioning that the selection window is very useful for developers. Due to mouse interaction functionality extensively relating to 3D objects in simulation software, the related development work is significant and difficult to maintain. The selection window provides instant selection information, allowing developers to know the current selection state without using a debugger, which can save a lot of development and debugging time.
Output
The output window displays the various text information generated by the system, similar to a notepad tool. It is commonly placed at the bottom of the screen. The main function of the output window is to prompt various errors and warnings to guide users to solve problems. This message prompt mechanism in a fixed window is superior to pop-up windows and enhances the user experience. When users are setting up simulation analysis, being interrupted in their thought process by pop-up windows would be an annoying and sour experience.
WELSIM’s output window not only provides diverse types of information to users, which helps them quickly resolve issues in analysis settings, but also offers common text functions such as copy, select all, clear, and export.
Similar to the output window, modern simulation software also supports console command windows, such as input controls for interpreted languages like Python. Currently, WELSIM does not support a console window but will add related functions in future iterations of the product.
Table
The table window is primarily used for displaying data and sometimes provides the ability to modify data. It’s commonly placed on the right side of the screen. As a general-purpose simulation software, the table window needs to support various types of data and units, such as boundary condition data, result data, material test data, curve fitting data, and more. It should support functions like unit modification, data sorting, data import and export. The complexity of these requirements makes the design and development of a table window for general-purpose simulation software challenging and difficult to maintain. This is why many simulation softwares either lack a table window or provide limited functionality, resulting in an unfavorable user experience. WELSIM, after years of development and iteration, has established a fully functional and user-friendly table window. All of the mentioned features have been implemented.
Chart
The chart window is used to display two-dimensional curves. The chart window shares data with the previously mentioned table window and is typically placed below it. Visualizing the tabular data through graphs and curves is an essential aspect of enhancing the user experience. In practical multi-step simulation analysis, boundary conditions and computing results often vary significantly over time. The chart window allows users to easily identify and interpret the data, greatly improving the user experience.
The chart window consists of the curves, x and y axes (including labels, scales, and units), curve labels, and other detailed elements. As shown in the image below, WELSIM’s chart window already includes these components, featuring a visually appealing and practical design. The floating menu in the top left corner provides options to modify the details of the chart, such as adjusting line widths and axis label font sizes. Users can customize the display of the curves according to their preferences.
The chart window in WELSIM also serves an important role in controlling the animated display of the 3D graphics. When a user selects a result object in the project tree, WELSIM displays a playback controller above the chart window. This controller allows users to control the analysis steps for the result display. By clicking the play button, the 3D window continuously shows the contour changes over time. Additionally, there is an animation button that enables users to generate simulation result videos with just one click.
Some simulation software’s chart windows support editing operations. Currently, WELSIM does not support data editing yet, but it may be added in future versions based on the product’s needs.
Conclusion
This article, using WELSIM as an example, summarizes the design and development of commonly used windows in general-purpose engineering simulation software. Window design in simulation software has matured over the years, with established user interaction patterns. Developers need to respect user habits while innovating and optimizing various functions in detail to enhance the user experience. The goal is to make simulation software more user-friendly. WELSIM will continue to maintain and improve its existing windows and their contents, providing users with more stable and accessible engineering simulation software.
WelSim is an independent engineering simulation software provider, located in Greater Pittsburgh, PA. Its flagship product WESLIM is a general-purpose engineering simulation software with an all-in-one graphical user interface and self-integrated features.
reacted with thumbs up emoji reacted with thumbs down emoji reacted with laugh emoji reacted with hooray emoji reacted with confused emoji reacted with heart emoji reacted with rocket emoji reacted with eyes emoji
-
Modern simulation engineering places high demands on software design and functionality. Not only do softwares need to provide extensive and detailed features, but simplicity, elegance, and user-friendliness are also required. The window serves as the direct area of software interaction and is the best way to differentiate various functions. The quality of window design directly affects the user experience. An excellent general-purpose simulation software relates in unison with a good window design. Through years of development and iteration, WELSIM has optimized the design of numerous windows, offering friendly interaction and stability for analyzing various physical fields such as structures, heat, fluids, and electromagnetics. This article uses WELSIM as an example to provide a detailed introduction to commonly used windows in engineering simulation software (including Finite Element Analysis (FEA), Computational Fluid Dynamics (CFD), etc.).
Project Tree
The project tree is an essential window in modern large-scale simulation software and is often placed on the left side of the screen. The tree can handle and express complex relations, intuitively displaying the simulation model to the user as a “what you see is what you get” representation. Users can easily add, edit, duplicate, or delete objects, dynamically controlling the components required for simulation analysis. The right-click context menu in the project tree plays an important role. The context menu is described in further detail in the article, “Design and development of context menu in simulation software”, so it won’t be repeated here.
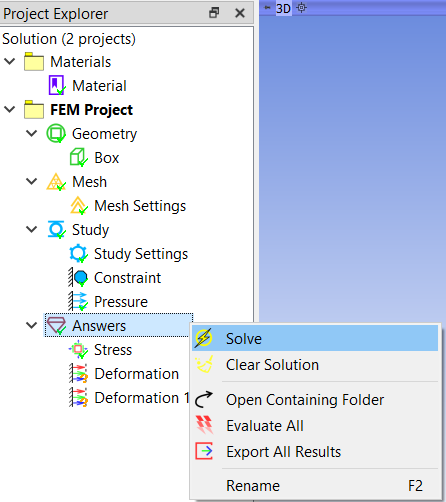
WELSIM’s project tree provides an object status engine, displaying the current status of each object (e.g., success, error, undefined) in the bottom right corner of the object icon. This feature helps users easily understand the status of all objects, greatly enhancing the user experience. However, designing and developing a usable and maintainable object status engine is a challenge due to the complexity of general-purpose simulation software.
The tree structure itself can handle complex trunk-branch connections, so there is no need for multiple tabs to accommodate multiple trees. WELSIM’s project tree window does not have multiple tabs.
Properties
The properties window is a powerful addition to the project tree and is often placed below the project tree window. It serves as the main interface for inputting simulation data. The property window dynamically displays the data content of the current node, allowing users to input or modify data. WELSIM’s property window supports various types of quantities and units, as well as the ability to switch to table data input. This is important for setting various boundary conditions. As shown below, users can change the input of properties from the default constant to tabular.
WELSIM’s table window has two tabs: Data and 3D View, with Data being the default tab. For certain objects, control of the 3D display is required, such as changing colors and line styles, displaying mesh, enabling deformations, etc. Separating data and 3D display properties into two different tabs ensures clear categories which enhances the user experience.
3D Graphics
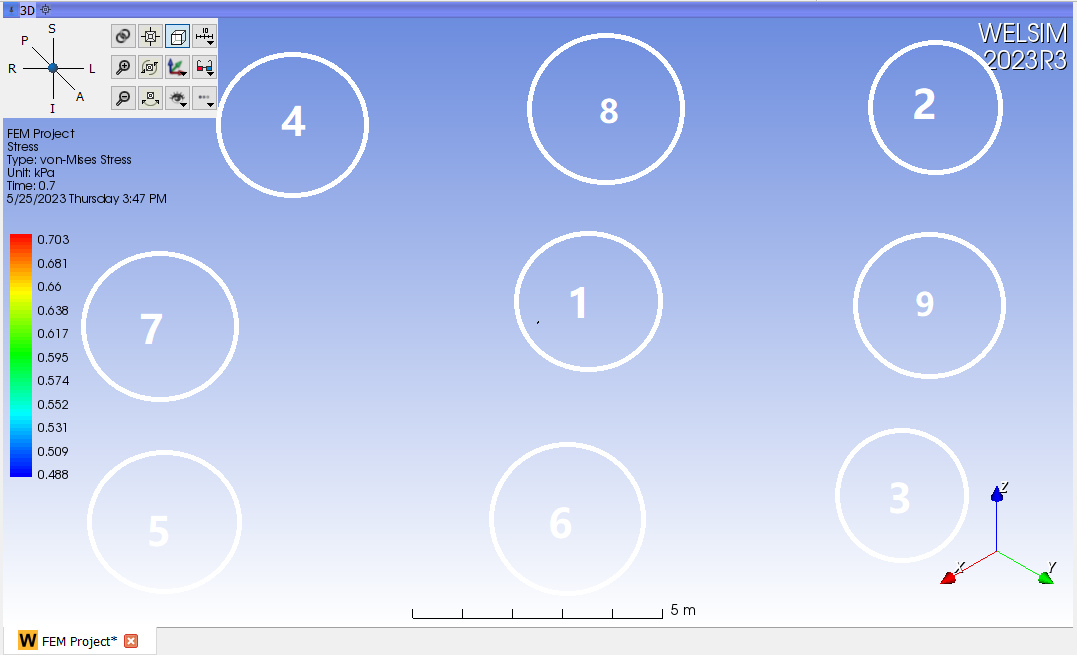
The 3D graphics window occupies the main space on the screen and is the primary module of simulation software. As a result, there are many components that have to be provided. This can present challenges in design and development. If constructed properly, it will provide users with a clear and concise experience. Improper design can lead to negative consequences with user experience, and even lead to product failure. WELSIM divides the 3D view window into nine regions, as shown in the figure below. These nine regions are classified into three levels. The most important first level is located in central Region 1, which is used to display the 3D model and occupies over 70% of the window space. The second level consists of the four corners of the window, notably Regions 2, 3, 4, and 5, which are used to view information, such as the software name and version, 3D coordinate axis, hover menu, 2D annotations, and multi-body penetration selection. The third level is located in the top, bottom, left, and right positions, namely Regions 6, 7, 8, and 9. They are used to display rulers, result color bar controllers, and other elements.
As shown above, each of the numbered regions and their controls has countless details worth discussing, but due to space limitations, they will be explained in future articles.
In addition, the 3D graphics window involves frequent mouse and keyboard interaction. It requires careful design and development to create efficient mouse clicks, wheel scrolls, and actions combined with keyboard functions (such as Ctrl and Shift keys). The mouse interaction design needs to accommodate user habits while being innovative and more accessible.
Selection View
General simulation software involves constant mouse interactions in the 3D graphics area, the majority of the interaction being caused by the selection of geometry or meshes. The WELSIM selection window provides instant selection information to help users confirm their current selection.
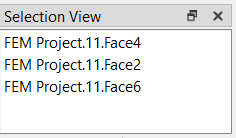
It is worth mentioning that the selection window is very useful for developers. Due to mouse interaction functionality extensively relating to 3D objects in simulation software, the related development work is significant and difficult to maintain. The selection window provides instant selection information, allowing developers to know the current selection state without using a debugger, which can save a lot of development and debugging time.
Output
The output window displays the various text information generated by the system, similar to a notepad tool. It is commonly placed at the bottom of the screen. The main function of the output window is to prompt various errors and warnings to guide users to solve problems. This message prompt mechanism in a fixed window is superior to pop-up windows and enhances the user experience. When users are setting up simulation analysis, being interrupted in their thought process by pop-up windows would be an annoying and sour experience.
WELSIM’s output window not only provides diverse types of information to users, which helps them quickly resolve issues in analysis settings, but also offers common text functions such as copy, select all, clear, and export.

Similar to the output window, modern simulation software also supports console command windows, such as input controls for interpreted languages like Python. Currently, WELSIM does not support a console window but will add related functions in future iterations of the product.
Table
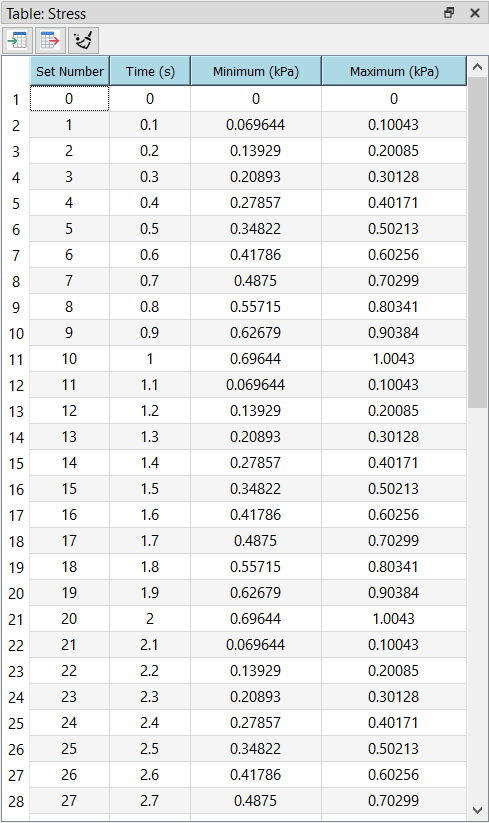
The table window is primarily used for displaying data and sometimes provides the ability to modify data. It’s commonly placed on the right side of the screen. As a general-purpose simulation software, the table window needs to support various types of data and units, such as boundary condition data, result data, material test data, curve fitting data, and more. It should support functions like unit modification, data sorting, data import and export. The complexity of these requirements makes the design and development of a table window for general-purpose simulation software challenging and difficult to maintain. This is why many simulation softwares either lack a table window or provide limited functionality, resulting in an unfavorable user experience. WELSIM, after years of development and iteration, has established a fully functional and user-friendly table window. All of the mentioned features have been implemented.
Chart
The chart window is used to display two-dimensional curves. The chart window shares data with the previously mentioned table window and is typically placed below it. Visualizing the tabular data through graphs and curves is an essential aspect of enhancing the user experience. In practical multi-step simulation analysis, boundary conditions and computing results often vary significantly over time. The chart window allows users to easily identify and interpret the data, greatly improving the user experience.
The chart window consists of the curves, x and y axes (including labels, scales, and units), curve labels, and other detailed elements. As shown in the image below, WELSIM’s chart window already includes these components, featuring a visually appealing and practical design. The floating menu in the top left corner provides options to modify the details of the chart, such as adjusting line widths and axis label font sizes. Users can customize the display of the curves according to their preferences.
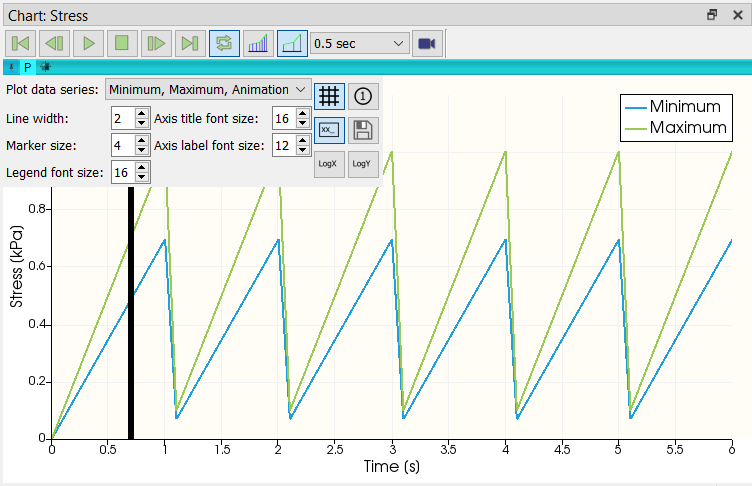
The chart window in WELSIM also serves an important role in controlling the animated display of the 3D graphics. When a user selects a result object in the project tree, WELSIM displays a playback controller above the chart window. This controller allows users to control the analysis steps for the result display. By clicking the play button, the 3D window continuously shows the contour changes over time. Additionally, there is an animation button that enables users to generate simulation result videos with just one click.
Some simulation software’s chart windows support editing operations. Currently, WELSIM does not support data editing yet, but it may be added in future versions based on the product’s needs.
Conclusion
This article, using WELSIM as an example, summarizes the design and development of commonly used windows in general-purpose engineering simulation software. Window design in simulation software has matured over the years, with established user interaction patterns. Developers need to respect user habits while innovating and optimizing various functions in detail to enhance the user experience. The goal is to make simulation software more user-friendly. WELSIM will continue to maintain and improve its existing windows and their contents, providing users with more stable and accessible engineering simulation software.
WelSim is an independent engineering simulation software provider, located in Greater Pittsburgh, PA. Its flagship product WESLIM is a general-purpose engineering simulation software with an all-in-one graphical user interface and self-integrated features.
Beta Was this translation helpful? Give feedback.
All reactions