Recipes show you how to make mashup Keen IO queries in novel ways. Got some cool recipes to share? Add 'em here!
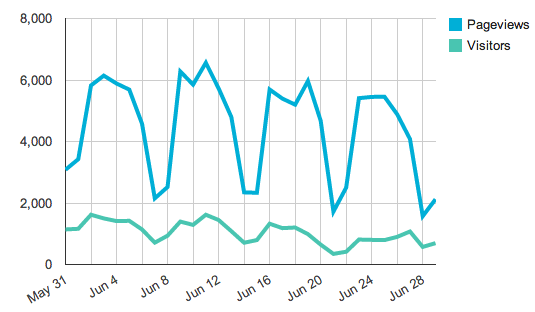
Here's an example that takes the data from two different line charts and plots them both onto the same graph.
// use a variable to ensure timeframe & interval for both queries match
var interval = "daily"
var timeframe = "last_30_days"

var pageviews = new Keen.Query("count", { // first query
	eventCollection: "pageviews",
	interval: interval,
	timeframe: timeframe
});

var uniqueVisitors = new Keen.Query("count_unique", { // second query
	eventCollection: "pageviews",
	targetProperty: "uuid",
	interval: interval,
	timeframe: timeframe
});

var chart = new Keen.Dataviz()
	.el(document.getElementById("pageviews"))
	.chartType("linechart")
	.chartOptions({
		hAxis: {
			format:'MMM d',
			gridlines:  {count: 12}
		}
	})
	.prepare();

client.run([pageviews, uniqueVisitors], function(err, response){ // run the queries
	// if (err) handle the error

	var result1 = response[0].result  // data from first query
	var result2 = response[1].result  // data from second query
	var data = []  // place for combined results
	var i=0

	while (i < result1.length) {

		data[i]={ // format the data so it can be charted
			timeframe: result1[i]["timeframe"],
			value: [
				{ category: "Pageviews", result: result1[i]["value"] },
				{ category: "Visitors", result: result2[i]["value"] }
			]
		}
		if (i == result1.length-1) {
			// chart the data
			chart
				.parseRawData({ result: data })
				.render();
		}
		i++;
	}
});This recipe can be used to calculate stuff like average number of connections per device, posts per user, pageviews per visitor, errors per server, logins per account, etc.
In one query you determine the number of items over a time period (e.g. number of posts daily for the past 30 days).
In the second query you determine the number of unique posters who made those posts.
Then you divide the two to determine the average.
Keen.ready(function(){

  // use a variable to ensure timeframe & interval for both queries match
  var interval = "daily"
  var timeframe = "last_30_days"

  var posts = new Keen.Query("count", { // first query
    eventCollection: "posts",
    interval: interval,
    timeframe: timeframe
  });

  var uniquePosters= new Keen.Query("count_unique", { // second query
    eventCollection: "posts",
    targetProperty: "uuid",
    interval: interval,
    timeframe: timeframe
  });

	var chart = new Keen.Dataviz()
		.el(document.getElementById("chart1"))
		.chartType("linechart")
		.chartOptions({
			lineWidth: 3,
			hAxis: {
				format:'MMM d',
				gridlines:  {count: 12}
			}
		})
		.prepare();

  client.run([posts, uniquePosters], function(err, response){ // run the queries

    var result1 = response[0].result  // data from first query
    var result2 = response[1].result  // data from second query
    var data = []  // place for combined results
    var i=0

    while (i < result1.length) {

      data[i]={ // format the data so it can be charted
        timeframe: result1[i]["timeframe"],
        value: [
          { category: "Posts per peep", result: result1[i]["value"] / result2[i]["value"]}
        ]
      }
      if (i == result1.length-1) {
				// chart the data
				chart
					.parseRawData({ result: data })
					.render();
      }
      i++;
    }
  });
});This recipe helps you figure out what percentage of users come back and use your app/site/device X days after some activity (e.g. activation).
This kind of analysis is used very commonly in gaming. Game developers want to answer questions like: Are people coming back to play my game the next day? On day 10? On day 30? Is the new version of my game retaining users better than the last?
Please note that it takes a very long time to generate this chart, especially on large datasets. That's because a Keen Funnel Query is executed for every single point in the chart. If you checkout console when you run this, you'll see all the queries being executed there. The example here runs 7 funnel queries because it calculates retention for each of the past 7 days.
Each data point on the line chart tells you what percentage of users who signed up 30 days ago used the app that day.
<!DOCTYPE html>
<html lang='en'>
<head>
  <script src='https://ajax.googleapis.com/ajax/libs/jquery/1.10.2/jquery.js'></script>
  <script src="https://d26b395fwzu5fz.cloudfront.net/3.2.1/keen.min.js"></script>
  <script>

    var client = new Keen({
      projectId: projectId,
      readKey: readKey
    });

    var TIMEZONE_OFFSET = "-07:00"; // "US/Pacific" (PDT)

    Keen.ready(function(){

      // Last X days that will be displayed in the chart (keep this number small for best performance)
      var daysInChart = 7;

      // Use an action that identifies a first-time user
      var step1CollectionName = "installs";

      // Use an action that happen every session
      var step2CollectionName = "session_starts";

      var actorProperty = "player_id" ;

      // Number of days ago the user did step1
      var retentionPeriod = 30;
      var div = "chart1";

			var chart = new Keen.Dataviz()
				.chartType("linechart")
				.colors(["#6ab975"])
				.el(document.getElementById(div))
				.title("New users still using the app " + retentionPeriod + " days later")
				.width(600)
				.chartOptions({
					legend: { position: "none" },
					vAxis: { format: '#,###.#%' },
					hAxis: { format:'MMM d'}
				})
				.prepare();

      calculateRetention(daysInChart, step1CollectionName, step2CollectionName, retentionPeriod, actorProperty, div);
    });

    function calculateRetention(daysInChart, step1CollectionName, step2CollectionName, retentionPeriod, actorProperty, div) {
      var dataForLineChart = [];

      for (i=0; i < daysInChart; i++) {

        (function(){
          var _i = arguments[0];

          // Calculate dates for when user does step 1
          var firstStepDate = new Date();
          firstStepDate.setDate(firstStepDate.getDate() - daysInChart - retentionPeriod + _i);
          firstStepDate.setUTCHours(0,0,0,0,0);

          var firstStepDateEnd = new Date(firstStepDate);
          firstStepDateEnd.setDate(firstStepDateEnd.getDate() + 1);

          // Calculate dates for when user does step 2
          var secondStepDate = new Date(firstStepDate);
          secondStepDate.setDate(firstStepDate.getDate() + retentionPeriod);

          var secondStepDateEnd = new Date(secondStepDate);
          secondStepDateEnd.setDate(secondStepDateEnd.getDate() + 1);

          // Funnel steps used for calculating retention
          var step1 = {
            eventCollection: step1CollectionName,
            actorProperty: actorProperty,
            timeframe: {
              start: firstStepDate.toISOString().replace("Z","") + TIMEZONE_OFFSET,
              end: firstStepDateEnd.toISOString().replace("Z","") + TIMEZONE_OFFSET
            }
          };

          var step2 = {
            eventCollection: step2CollectionName,
            actorProperty: actorProperty,
            timeframe: {
              start: secondStepDate.toISOString().replace("Z","") + TIMEZONE_OFFSET,
              end: secondStepDateEnd.toISOString().replace("Z","") + TIMEZONE_OFFSET
            }
          };

          var funnel = new Keen.Query('funnel', {steps: [step1, step2]});

          client.run(funnel, function(err, response){
            var percentage = response.result[1]/response.result[0]
            dataForLineChart.push({
              "value" : percentage,
              "timeframe" : {
                "start" : response.steps[1].timeframe["start"],
                "end" : response.steps[1].timeframe["end"]
              }
            })

            if (dataForLineChart.length == daysInChart) {

	            // Need to sort data for line chart!
	            dataForLineChart.sort(function(x, y){
	              date1 = new Date(x.timeframe["start"]);
	              date2 = new Date(y.timeframe["start"]);
	              return date1 - date2;
	            })

	            // draw it!
							chart
								.parseRawData({ result: dataForLineChart })
								.render();
            }
          });

        })(i);

      }
    }
  </script>
</head>
<body>
	<div id="chart1"></div>
</body>
</html>

