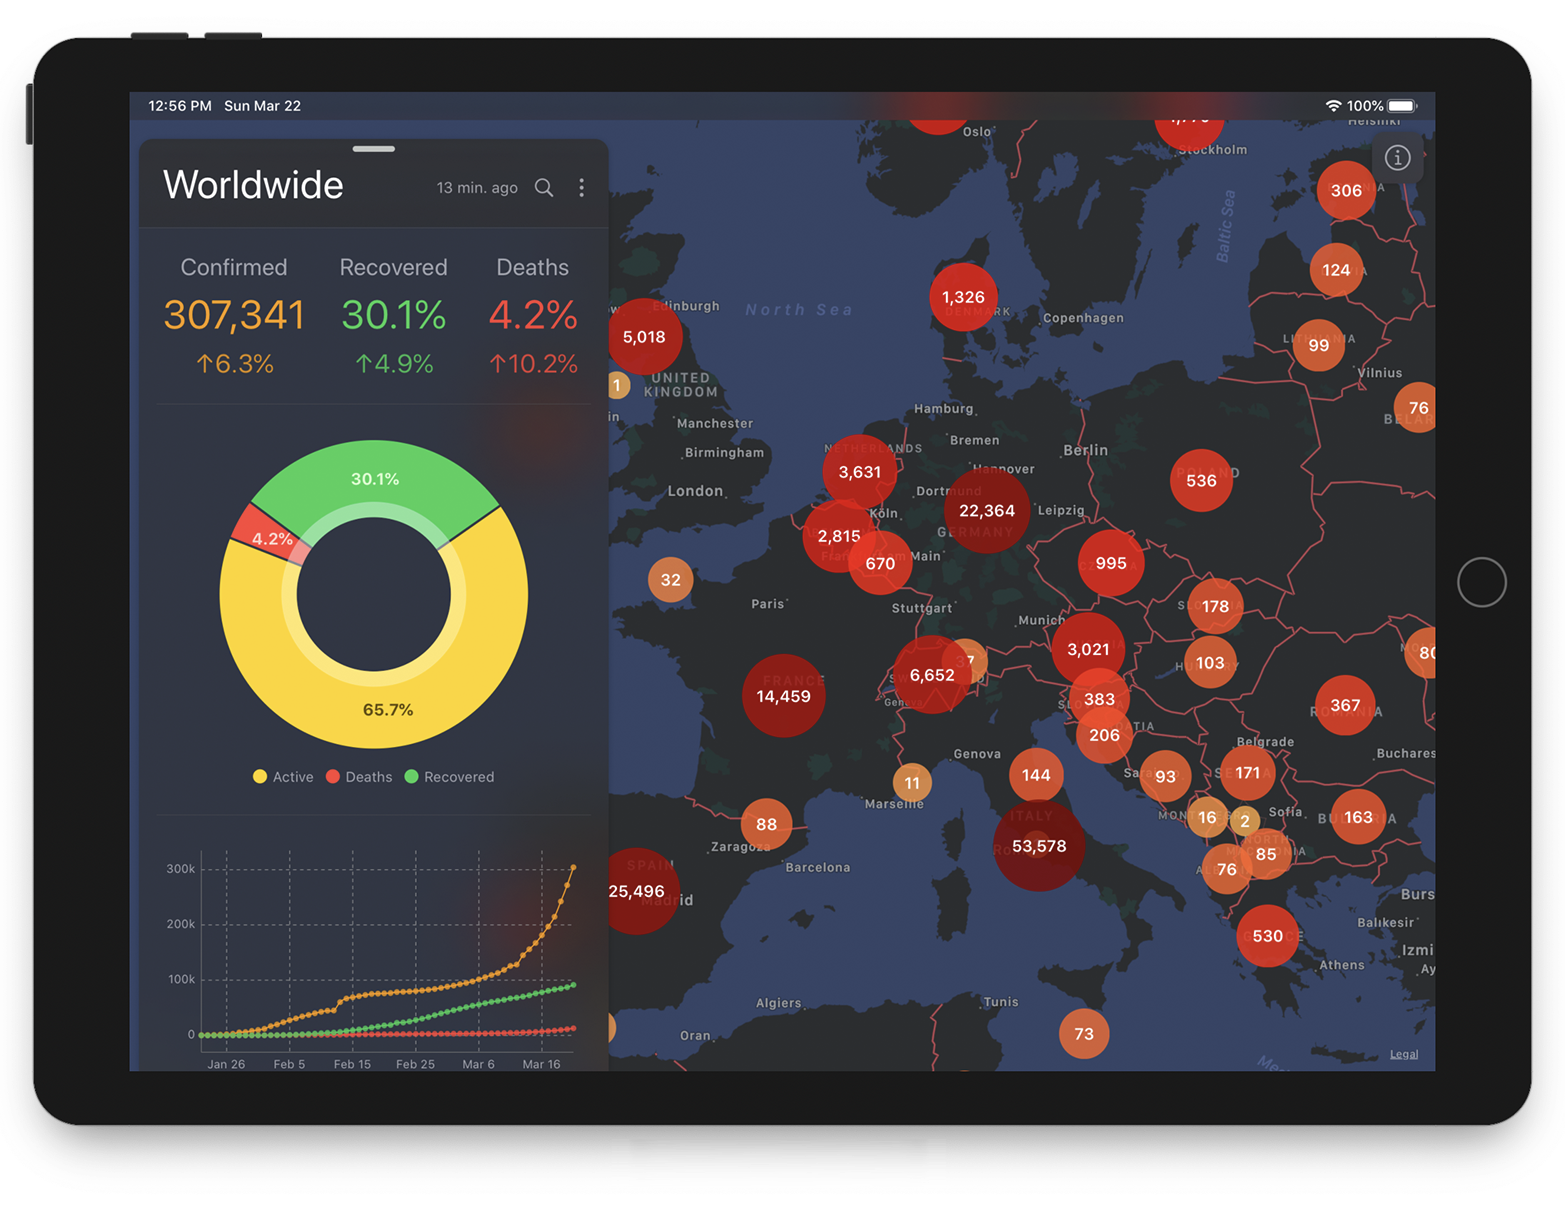
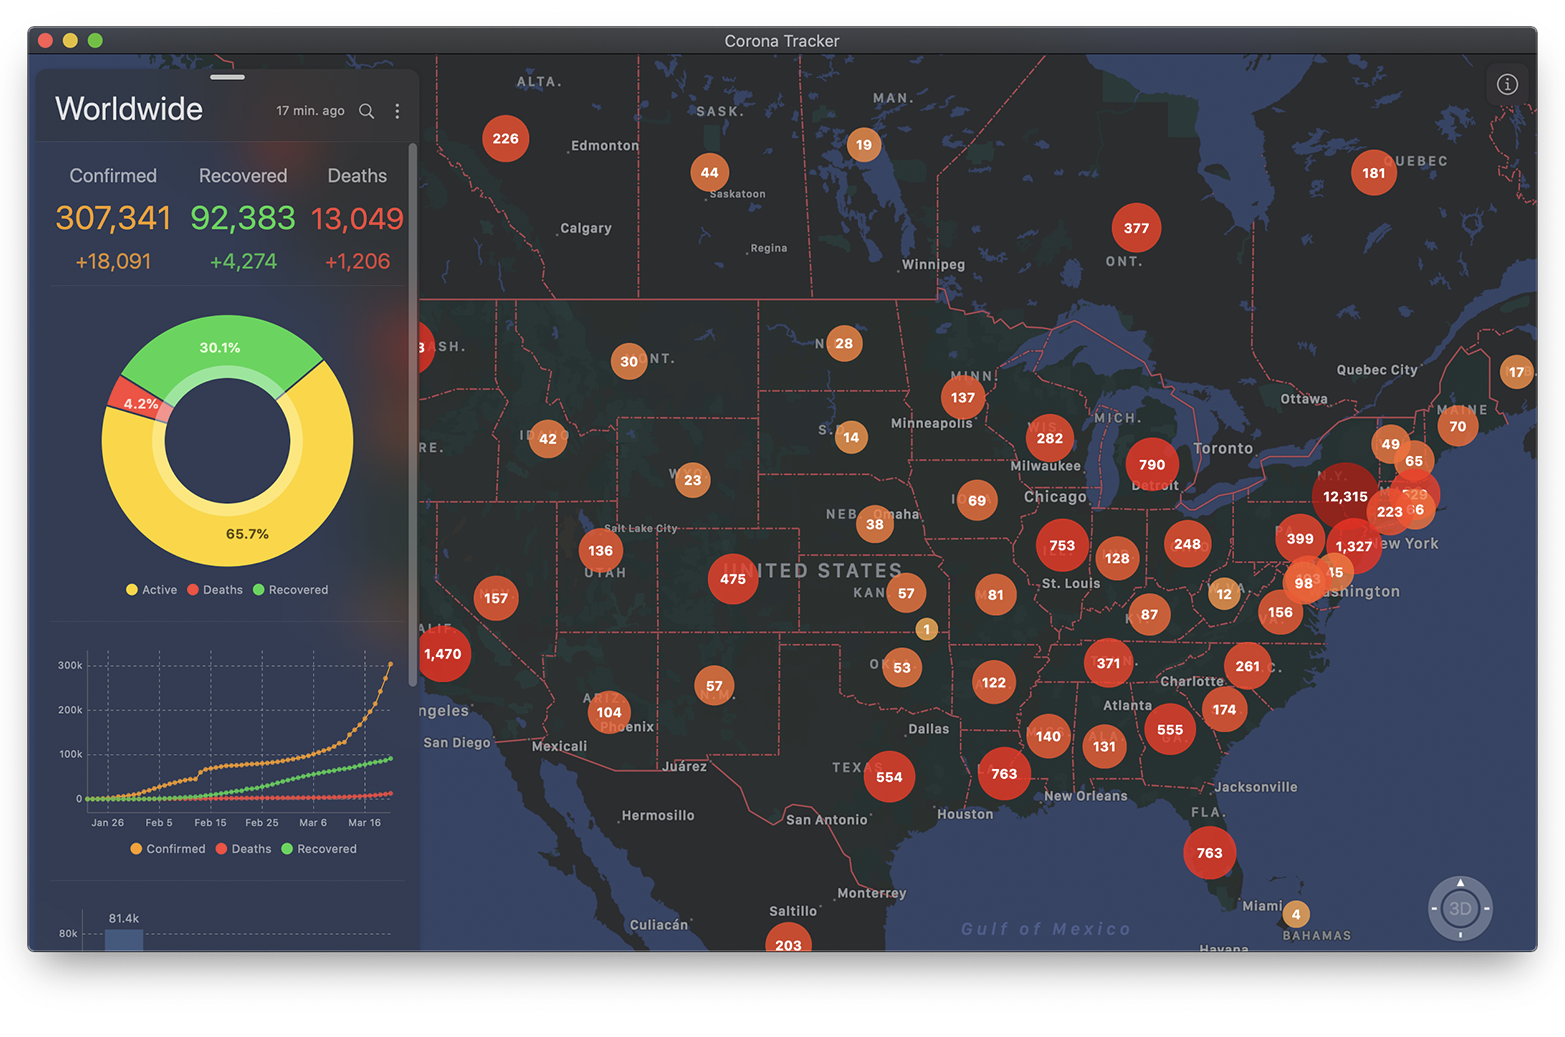
- Live data: Shows the most recent data, and updates automatically.
- Distribution map with two levels of details:
- Countries: When the user zooms out. Fewer details and reduced clutter.
- Cities: When the user zooms in. More details.
- Charts:
- Current state chart for all countries (and cities).
- Timeline chart for all countries (and cities).
- Top affected countries chart with info about every country.
- Daily new cases shows how fast the virus is spreading in a given country.
- Cases since the 100th case how fast the virus is spreading in different countries.
- Option for using a logarithmic scale.
- Search for countries & cities.
- Share stats & charts as images.
- Today widget for worldwide stats (Contributed by Piotr Ożóg).
- Red color scale: Reflects the number of confirmed cases. In addition to increasing circle size.
- Statistics: Including the number of confirmed, recovered, and deaths, in addition to percents.
- iPad & macOS support.
- Clone/Download the repo.
- Open
Corona.xcodeprojin Xcode. - Choose the right target (iOS or macOS).
- Build & run!
Download the latest release for macOS.
Or install via brew:
brew cask install corona-trackerPlease feel free to contribute pull requests or create issues for bugs and feature requests.
Mhd Hejazi 
Data is provided by JHU CSSE (https://github.com/CSSEGISandData/COVID-19).
- German by @sebastianbinder
- Swedish by @FluffyDev2019
- Portuguese by @ppamorim
- Italian by @Ale111
- French by @Risengan
- Russian by @wacumov
- Chinese, Simplified by @erickzli
- Spanish by @ejewik
- Japanese by @dev-sora
- Polish by @pbeo
- Dutch by @hdatteln
- Romanian by @rhcpfan
- Korean by @dev-yong
- Arabic by @hussamzain
- Norwegian Bokmål by @comradekingu
- Indonesian by @nikotidar
- Danish by @peme
- Chinese, Traditional (Taiwan) by @League2EB
- Turkish by @nesimtunc
- Hungarian by @BrotherLouie
- CSV.swift: For parsing the CSV data file.
- Charts: Beautiful and powerful charts.
- FloatingPanel: For the bottom sheet.
- Disk: Simplifies loading/saving files.


