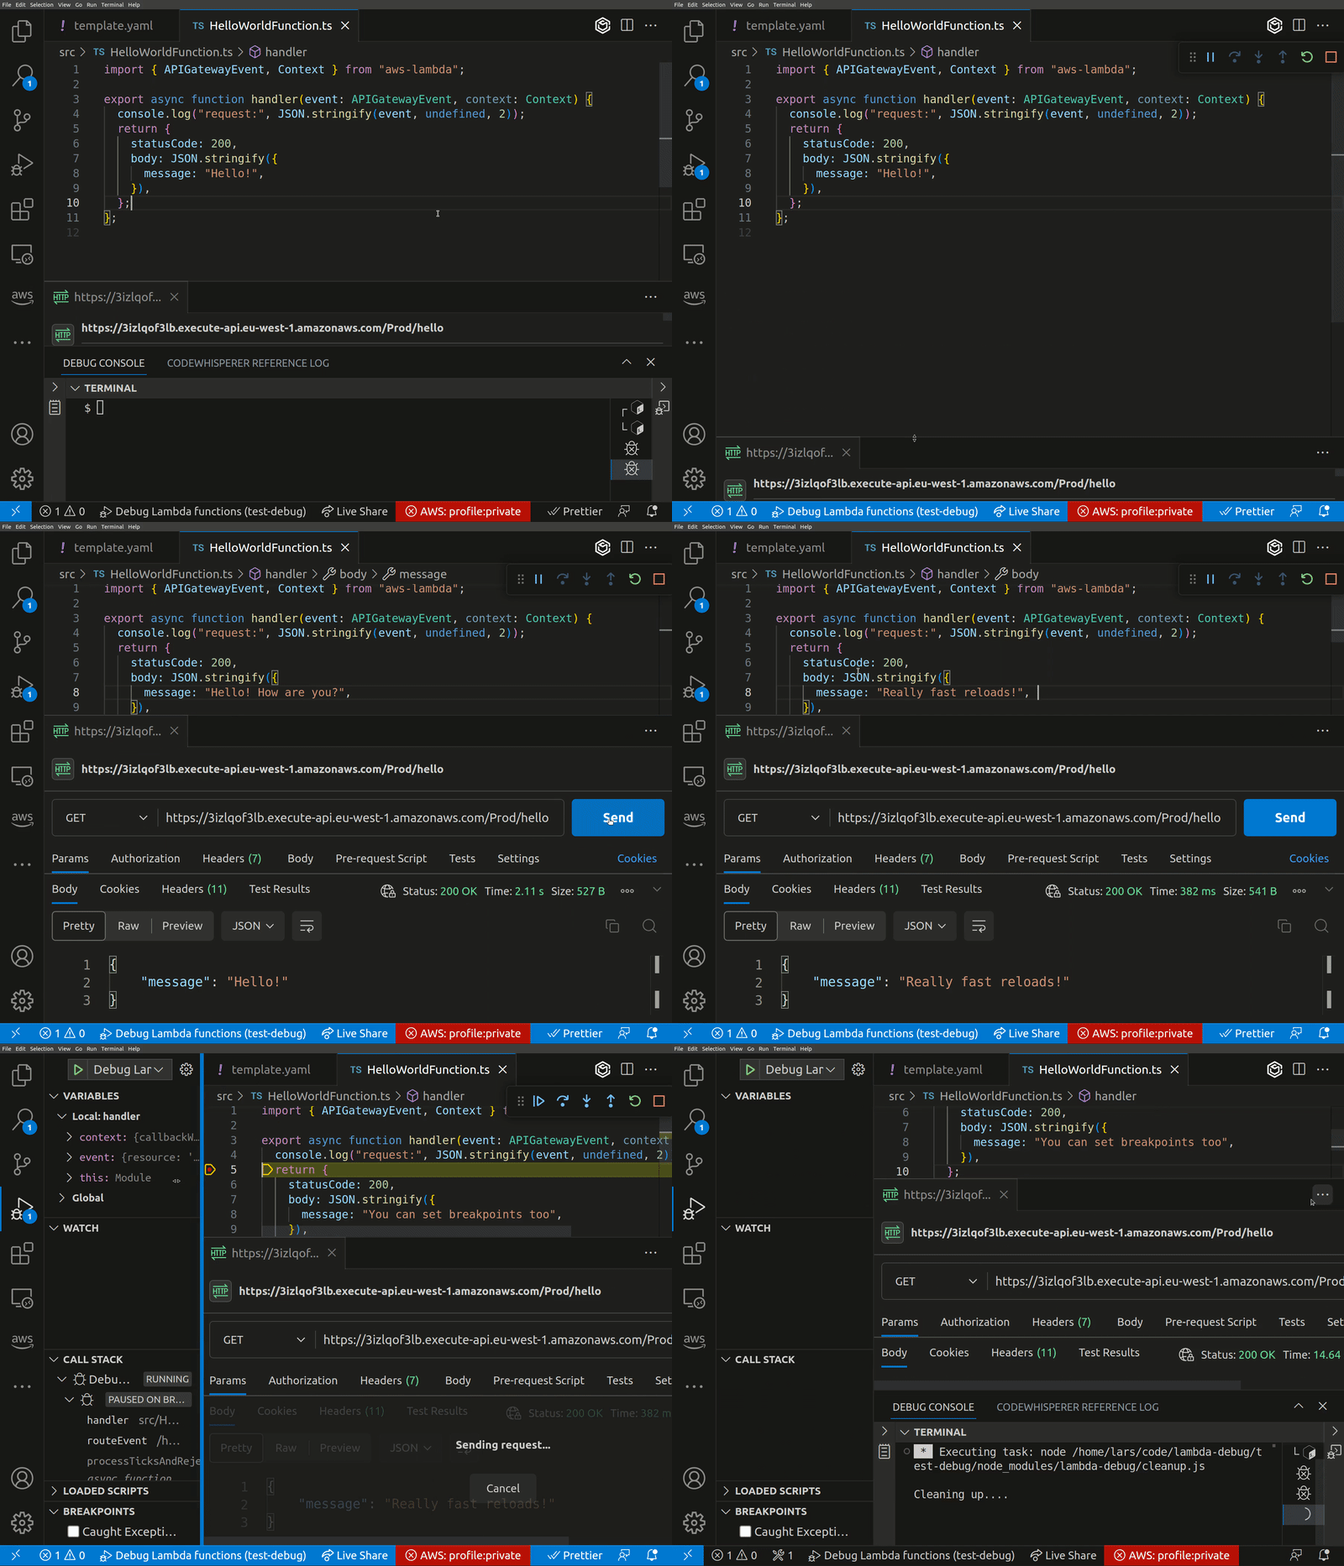
Please use samp-cli for a much smoother local debugging experience
Lambda-Debug is a tool that enables you to invoke AWS Lambda functions in the cloud from any event source and intercept the requests with breakpoints locally. There's similar functionality in SST which this is inspired by, but is designed to work with AWS SAM and CloudFormation and, in a later version, CDK.
<blink>** NOTE: This is intended to be used to debug functions in a development environment. DO NOT use in production. **</blink>
- 🏠 Local debugging: Set breakpoints in your code and step through your functions invocations locally on native events triggered in the cloud.
- 👍 No code changes: No need to modify your code to enable debugging. Just add some dev dependencies and some configuration.
- 🔐 Same IAM permissions: Your functions will run with the same IAM permissions as they do in the cloud.
- ⚡ Fast iterations: No need to deploy your code to the cloud to test changes. Just save your code and invoke your functions in the cloud.
Follow these steps to configure lambda-debug:
You need to install the lambda-debug and tsc-watch dependencies.
npm install --save-dev lambda-debug tsc-watch nodemon
Currently there's only config support for vscode, but nothing suggests this can't be used with other code editors.
npx lambda-debug-setup
This will update tsconfig.json, .vscode/launch-config and .vscode/tasks.json. Make sure to review the diff to understand the changes.
Summary of changes
Add the following to your tsconfig.json file along with the rest of your config:
{
  "extends": "@tsconfig/node18/tsconfig.json",
  "compilerOptions": {
    "resolveJsonModule": true,
    "outDir": "dist",
    "sourceMap": true
  },
  "exclude": ["node_modules", "dist/**/*"]
}Add the following configuration to your .vscode/launch.json file:
{
  "version": "0.2.0",
  "configurations": [
    {
      "type": "node",
      "request": "launch",
      "name": "Debug Lambda functions",
      "runtimeExecutable": "${workspaceFolder}/node_modules/.bin/nodemon",
      "skipFiles": ["<node_internals>/**"],
      "program": "${workspaceFolder}/node_modules/lambda-debug/connect.js",
      "restart": true,
      "env": {
        "outDir": "dist"
      },
      "postDebugTask": "lambda-debug-cleanup",
      "console": "integratedTerminal",
      "internalConsoleOptions": "neverOpen"
    },
  ]
}Add the following task to your .vscode/tasks.json file:
{
  "version": "2.0.0",
  "tasks": [
    {
      "label": "lambda-debug-cleanup",
      "type": "shell",
      "command": "node ${workspaceFolder}/node_modules/lambda-debug/cleanup.js"
    }
  ]
}Deploy your stack using SAM if you haven't already done so. You'll need the SAM CLI for this. Check out the AWS SAM CLI documentation for more information.
sam deploy
Use tsc-watch to set up a file listener that automatically compiles your TypeScript files as you change them. You can start it with the following command:
npx tsc-watch
Now you're ready to debug. Set some breakpoints in your code, hit F5 in VS Code to start debugging, and then invoke your functions in the cloud. You'll be able to step through your function invocations locally in VS Code, just as if the code were running on your machine.
The env section within your .vscode/launch.json allows you to set environment variables that define how Lambda-Debug operates. Here's a brief explanation of each variable:
-
outDir: This is where your compiled JavaScript files are located after TypeScript compilation. For example, if you have set "outDir" to "dist", Lambda-Debug will look for the compiled JavaScript files in the "dist" folder.
-
configEnv: This specifies the environment to use from your samconfig.toml-file. For example, if you have multiple profiles for different AWS environments (such as
default,staging,production), you can set "configEnv" to the one you want to use. -
includeFunctions: If you wish to debug only specific functions, list them here, separating multiple function names with a comma. For example, "HelloWorldFunction,AnotherFunction". If left empty, all functions will be included.
-
excludeFunctions: Use this if you wish to exclude certain functions from being debugged. List the functions you want to exclude, separating multiple function names with a comma. For example, "GoodbyeWorldFunction,SomeOtherFunction". If left empty, no functions will be excluded.
-
timeout: This is the timeout in seconds that will allocated to your function when debugging. The default is 300 seconds. If you spend longer than this on a breakpoint then you'll be allowd to finish stepping through the code, but any return value will be ignored.
Lambda-debug temporarily replaces your function code with a relay proxy function. This relay sets up an MQTT connection with your local machine over AWS IoT, enabling a bidirectional transfer of execution context between the cloud and your local machine.
While in debug mode, the function's configuration is tweaked to better accommodate local debugging needs:
- Timeout: The function's timeout is increased. This extension is to ensure that your function does not time out while you are stepping through code in the debugger.
- MemorySize: The memory allocation is reduced to 128mb. Given that the actual compute happens on your local machine when debugging, this smaller memory footprint helps minimize costs without impacting performance.
Though AWS IoT usage in this scenario doesn't carry additional costs, be aware that while a function is at a breakpoint during debugging, AWS charges approximately $0.0000000021 per millisecond or roughly $0.0076 per accumulated hour.
Once your debugging session is concluded, Lambda-Debug restores your function back to its original state. This includes resetting the function code as well as the function configuration to their original values, ensuring your live environment is left untouched and as intended.
This is due to a bug in the aws-sdk-v3 and is unrelated to this project. It happens sometimes when the SSO session expires. To get around this, go to your sso start url, clear cookies and log in again
When the code is changed, the debugger will reload. This results in a sub-second (depending on your internet connection) disconnection from the MQTT topic. If your function invocation happens during this time, it will not reach your code. To avoid this, wait a few seconds after making a code change before invoking your function.
