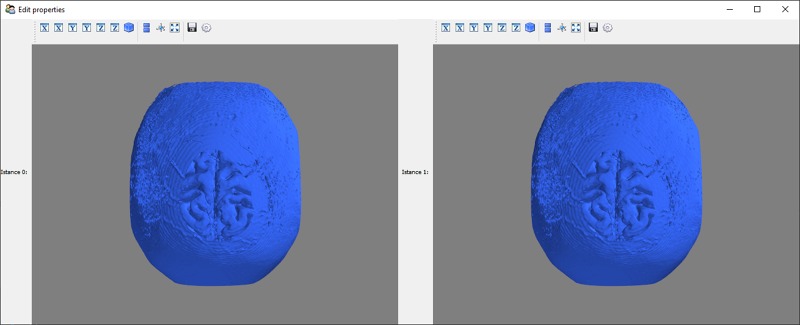
This is a Python class for plotting one or more numpy volumes in multiple windows wrapped into a single view (based on mayavi).
Use the package manager pip to install mayavi and its dependencies, that's all we need.
pip install mayavi
pip install PyQt5You can plot numpy volumes by passing several list of volumes to the class; each list corresponds to an independent subwindow in the view. The following example will plot volume_1 and volume_2 in two separate windows as shown below.
MultiView([volume_1], [volume_2]).show()you can create as many windows as you want by adding more and more lists:
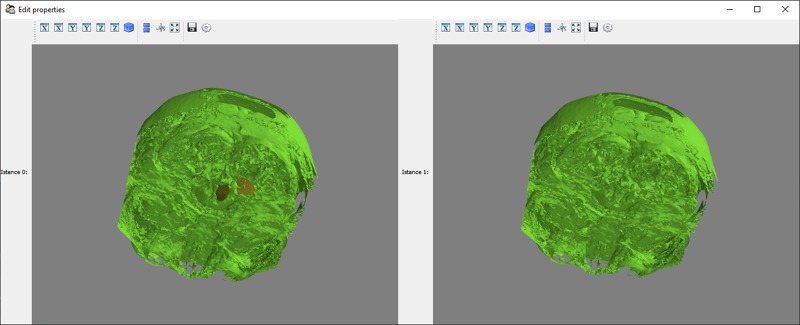
MultiView([volume_1], [volume_2], [volume_n]).show()you can plot more volumes in a window by simply adding them to a list. The following example plots two volumes in the first windows but you could provide with how many you want, they'll just overlap each other.
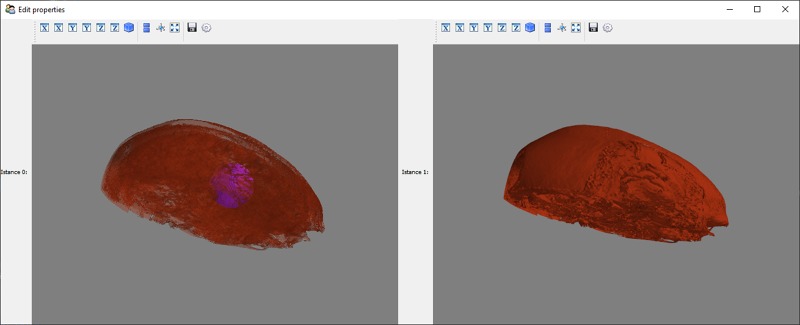
MultiView([volume_1, sphere], [volume_2]).show()when plotting more than one volume in a window the overlapped volumes can result in a fuzzy view. it is possible to specify the opacity of a volume by just passing a tuple (volume, opacity) instead of the volume directly as show below.
MultiView([(big_one, 0.4), sphere], [volume_2]]).show()


